1.4 Calibration of an Instrument/Detector
We now have a basis for understanding separation science with respect to chromatography. All chromatography systems rely on these principles. But how does the analyst relate instrument output to analyte concentration in a sample? Instruments yield signals (also referred to as responses) that are specific to the type of detector being used. Most GC detectors result in electrical currents while most LC detectors yield absorbance values. MS units can be attached to both GC and LC systems and yield counts of ions per time. But before actual samples are analyzed each instrument detector must be calibrated. Two common forms of calibration are internal and external calibration.
Detector response yields two useful means of quantification in chromatography: peak area and peak height. In the “old days” these measurements were made manually; a strip chart recording was obtained by passing a strip of paper consisting of uniform weight past a pen that moved relative to the detector signal. The shape of the peak was drawn on the paper and the peak height was measured with a ruler or the peak area was measured either by triangulation or by actually weighing a cutout of the paper containing the peak! Fortunately for us, these archaic methods are no longer required. The major disadvantage of these techniques is that the range of detector responses was limited by the height of the paper. Today, peak area and height measurements are calculated by electronic integrators or computers, and most systems are automated such that peak area/height are directly correlated between standards and samples. Most systems use peak area to generate calibration lines, which are usually linear relationships between the detector response and the concentration or mass of analyte injected into the instrument. Such a plot is shown for an external calibration method in Figure 1.7.
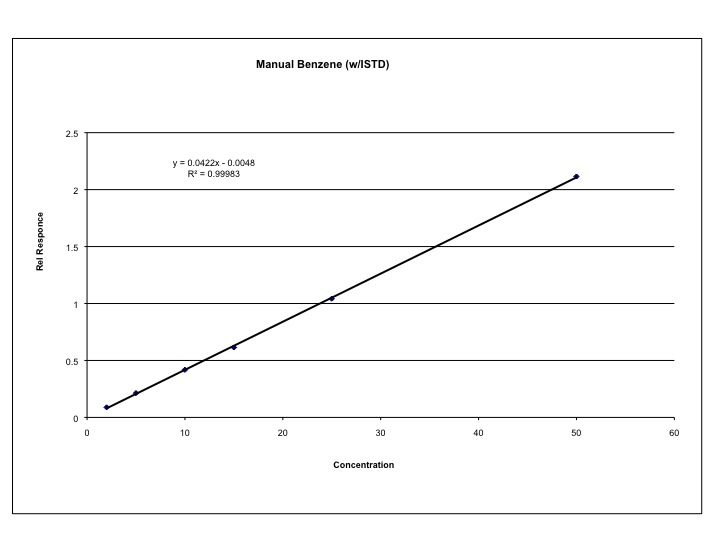
Figure 1.7 External Calibration of Benzene on a Capillary Column GC.
A summary of integration concepts is illustrated in Animation 1.5. Click on the figure to begin the animation.
Animation 1.5 Integration of Chromatographic Peaks.
After an instrument has been calibrated, a sample extract is analyzed under the same conditions as the standards. The calculated area for the sample is then analyzed by a linear regression of the standard line and a mass or concentration of the analyte in the sample is calculated. Usually a dilution factor adjustment is made and the concentration of analyte in the original sample is then calculated.
A special type of additional calibration is used in capillary column gas chromatography because of analyte losses during sample injection and due to the possibility of inconsistent injections when manual injections are preformed. This method is referred to as an “internal standard” where every sample and standard injected into the instrument contains an identical concentration of a compound with similar chemical structure to the analyte but one that has a unique retention time in the column. The instrument is set to measure a constant concentration (and therefore measured area) of the internal standard and adjusts all injections to that constant value. For example, if a sample is found to only contain 90 percent of the internal standard, then it is assumed that 10 percent of the injection was lost and all analyte concentrations are increased by 10 percent. Similarly adjusts can be made of over injecting a sample.
The next chapters of this book will focus on the components of GC, LC, CE and MS with an additional chapter on interpretation of MS fragmentation patterns. Both GC and LC rely on the chromatography theory discussed in this chapter, but CE requires a different derivation that will discussed in Chapter 4. All instruments rely on some form of calibration if quantitative results are required.
| Frank's Homepage |
©Dunnivant & Ginsbach, 2008