5.5.3 Quadrupole ion trap mass filter
While the operation of the ion trap was characterized shortly after the linear quadrupole in 1960 by Paul and Steinwedel, its application in the chemical laboratory was severely limited. This was due to difficulties associated with manufacturing a circular electrode and performance problems. These performance problems were overcome when a group at Finnigan MAT lead by Stafford discovered two breakthroughs that lead to the production of a commercially available ion trap mass filter. The first ion trap developed used a mode of operation where a single mass could be stored in the trap when previously all of the ions had to be stored. Their next important discovery was the ability for 1 mtorr of helium gas to improve the instruments resolution. The helium molecules’ collisions with the ions reduced their kinetic energy and subsequently focused them towards the center of the trap.
After these initial hurdles were cleared, many new techniques were developed for a diverse set of applications especially in biochemistry. This is a result of its comparative advantage over the quadrupole when analyzing high molecular mass compounds (up to several thousand m/z units) to unit resolution in commonly encountered instruments. The ion trap is also an extremely sensitive instrument which allows a molecular weight to be determined with a small number of molecules. The ion trap is also the only mass filter that can contain ions that need to be analyzed for any significant duration of time. This allows the instrument to be particularly useful in monitoring the kinetics of a given reaction. The most powerful application of the ion trap is its ability to be used in tandem mass spectrometry (section 5.5.7).
The ion trap is made up of a single ring electrode that is placed in the X-Y plane between two end cap electrodes (Figure 5.15). Both an ac and dc voltage can be applied to the ring electrode while only an ac voltage can be applied to the end cap electrodes. The two end cap electrodes and the ring electrode ideally have a hyperbolic shape to establish an ideal field however in practice, non-ideal fields can operate effectively. While the ion trap is applying force to the charged ions in three directions, the problem can be simplified into a two-dimensional problem. Since the ring is symmetrical, the force in any direction is always the same. As a result of this symmetry, movement of the molecules can be expressed in terms of r and z where ![]() where x and y are coordinates. For commercially available instruments, r0 (the distance from the center of the trap to the ring electrode is either 1.00 or 0.707 cm.
where x and y are coordinates. For commercially available instruments, r0 (the distance from the center of the trap to the ring electrode is either 1.00 or 0.707 cm.
Figure 5.15 A Cross Section of the Ion Trap
After the sample molecules have been ionized by the source, they enter into the ion trap through an electric gate located on a single end cap electrode. This gate functions in the same fashion as the one that is utilized in time of flight mass spectrometry (Section 5.5.4). The gate’s purpose is to prevent a large number of molecules from entering into the trap. If too many sample molecules enter into the trap, the interaction with other molecules becomes significant resulting in space-charge effects, a distortion of the electrical field that minimizes the ion trap’s performance. Once the ions enter the trap, their collisions with the helium gas focus the ions towards the center of the trap. An ac frequency is also applied to the ring electrode to assist in focusing the ions towards the center of the trap.
In the ion trap, the ring electrode oscillates with a very high frequency (typically 1.1 MHz) while both the end cap electrodes are kept at a ground potential (U equals 0 Volts). This frequency causes the ion to oscillate in both the r and z direction (Figure 5.16). The oscillation in the r direction is an expected response to the force generated by the ring electrode. The oscillation in the z direction, on the other hand, may seem counter intuitive. This is a response to both the grounded end cap electrodes and the shape of the ring electrode. When the ac potential increases, the trajectory of the ion becomes unstable in the z direction. The theoretical basis for this motion will be discussed later. While it would be convenient to describe the ion trap’s function as a point charge responding to an electrical field, the complexity of the generated field makes this impractical.
Figure 5.16 The Trajectories of a Single Mass Within the Electrical Field. Figure 6 from Wong and Cooks, 1997. Reprinted with permission of Bioanalytical Systems, Inc., West Lafayette, IN.
The simplest way to understand how the ion trap creates mass spectra is to study how ions respond to the electrical field. It is necessary to begin by constructing a stability diagram for a single ion. Imagine a single mass to charge ratio being introduced into the ion trap. Then, the ac and dc voltages of the ring electrode are altered and the ions stability in both the z and r directions are determined simultaneously. If this experiment was performed multiple times, the stability diagram for that single mass would look similar to Figure 5.17.
Figure 5.17 A Single Mass Stability Diagram for an Ion Trap. Adapted from Figure 5 from Wong and Cooks, 1997. Reprinted with permission of Bioanalytical Systems, Inc., West Lafayette, IN.
The yellow area indicates the values of the ac and dc voltages where the given mass has a stable trajectory in the z direction but the ion’s trajectory in the r direction is unstable. As a result, the ion strikes the ring electrode, is neutralized, and removed by the vacuum. The blue area is voltages where the ion has a stable trajectory in the r direction, but not in the z direction. At these voltages, the ion exits the trap through the slits in the end cap electrode towards a detector. The detector is on if the analyst is attempting to generate a mass spectrum, and can be left off if the goal is to isolate a particular mass to charge ratio of interest. The gray-purple area is where the stability in both the r and z direction overlap. For these voltages, the ion has a stable trajectory and remains inside the trap.
Similar to the quadrupole mass filter, differential equations are able to expand the single mass stability diagram to a general stability diagram. The derivation of this result requires an in depth understanding of differential equations, so only the graphical result will be presented here (Figure 5.18). As with the linear quadrupole mass filter, the solution here is simplified from a six-variable problem to a simpler two-variable problem.
Figure 5.18 A General Stability Diagram. Adapted from Figure 5 from Wong and Cooks, 1997. Reprinted with permission of Bioanalytical Systems, Inc., West Lafayette, IN.
From the general stability diagram it becomes visible how scans can be performed by just altering the ac voltage on the ring electrode. But before we discuss the ion trap’s operation it is necessary to understand the parameters that affect ions stability within the field. The terms K1 and K2 are characterized by the following equations:
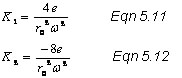
As expected, these parameters are very similar to the ones that resulted from the general stability diagram for the quadrupole mass filter. These parameters, like in the quadrupole, are also kept constant during a scan. The charge of the particle (e), the distance from the center of the trap to the ring electrode (ro), and the radial frequency of the ac voltage (ω) are all kept constant during the run. While it would be possible to alter both the ac and dc voltages, in practice it is only necessary to alter the ac voltage (V) of the ring electrode. The dc voltage (U) on the other hand, is kept at zero. If the dc voltage is kept at a ground potential, increasing the ac voltage will eventually result in an unstable trajectory in the z direction. When ac voltage creates a qz value that is greater than 0.908, the particle will be ejected from the trap towards a detector through the end cap electrode. As illustrated below, the qz value is dependent on the mass to charge ratio of the particle, each different mass has a unique ac voltage that causes them to exit the trap.
For example, let’s place four different ion masses into the ion trap where each has a single positive charge. The general stability diagram in Figure 5.19 is identical to Figure 5.18 except that it is focused around a dc voltage (U) of zero and the scale is enlarged; thus, ax is equal to zero through a scan. A mass scan is performed by starting the ring electrode out at a low ac voltage. Each distinct mass has a unique qz value, which is visually illustrated by placing these particles on the stability diagram. As the ac frequency begins to increase, the qz values for these masses also increases. Once the qz value becomes greater than 0.908, the ions still have a stable trajectory in the r direction but now have an unstable trajectory in the z direction. As a result, they are ejected out of the trap through the end cap electrode towards the detector.
Figure 5.19 A Stability Diagram During a Sample Scan
The stability diagram above at A, B, and C was the result of taking a snapshot of the ac voltage during the scan and placing each mass at its corresponding qz values for that particular voltage. In this mode of operation, the lightest masses (m1) are always ejected from the trap (Figure 15.19 B) before the heaver masses (m2). The heaviest masses (m3 and m4) still remain in the trap at point C. To eject these ions, a very large ac voltage is necessary. This voltage is so high that it becomes extremely difficulty to eject ions over a m/z value of 650. Since it is impractical to apply such high voltages to the electrode and its circuits, a new method of operation needed to be discovered so the ion trap could analyze more massive molecules.
As a result, resonance ejection was developed to extend the mass range of the ion trap to a m/z value of several thousand. Under normal scanning conditions, ions oscillate at a given frequency depending on their qz value which is a function of its mass, charge, and the amplitude of the ac voltage. This frequency is referred to as the ion’s secular frequency. It was discovered that an ac voltage applied to the end cap electrodes would only affect one ion’s secular frequency. The effected ion’s oscillation in the z direction would increase linearly until it was ejected from the trap. Resonance ejection can be conceptualized as a “hole” inside the stability diagram at any chosen qz value. Then the ac voltage of the ring electrode can be altered so any mass can have the same qz value as the “hole” and exit the trap in the z direction (Figure 5.20). This mode of operation not only extended the mass analyzer’s mass range, but it also made it possible to eject ions from the trap in any order. Before this mode of operation existed, it was only possible to eject the ions in order from lightest to heaviest. Figure 5.20 illustrates how it is possible to eject the heaviest ion (m4) before the lighter ion (m3).
Figure 5.20 A Sample Resonance Ejection Scan
The resonance ejection mode of operation is one reason why the ion trap is such a valuable tool. It not only greatly extends the mass range of the mass analyzer, but it also increased its applications in tandem spectroscopy (section 5.5.8). The ability to isolate any given mass under several thousand amu is an extremely powerful tool. Through the use of both modes of operation, the ion trap has become a valuable tool in performing many specialized mass separations.
View Animation 5.7 at this time for an illustration of how an ion trap mass filter contains and ejects ions of given mass to charge ratios.
Animation 5.7. Illustration of an Ion Trap Mass Filter.
| Frank's Homepage |
©Dunnivant & Ginsbach, 2008