4.2.6.2 Quadrupole mass filter
Quadrupole mass filters have become the most common type of mass filters today due to their relatively small size, light weight, low cost, and rapid scan times (less than 100 ms). This type of mass filter is most commonly used in conjunction with ICP systems because they are able to operate at a relatively high pressure (5 x 10⁻⁵ torr) as compared to lower pressures required in other mass filters. The quadrupole has also gained widespread use in tandem MS applications (a series of MS analyzers).
Despite the fact that quadrupoles produce the majority of mass spectra used today as mentioned earlier, they are not true mass spectrometers. Actual mass spectrometers produce a distribution of ions either through time (time of flight mass spectrometer) or space (magnetic sector mass spectrometer). The quadrupole’s mass resolving properties are instead a result of the ion’s stability/trajectory within the oscillating electrical field.
A quadrupole system consists of four rods that are arranged at an equal distance from each other in a parallel manner. Paul and Steinwegen theorized in 1953 that hyperbolic cross-sections were necessary. In practice, it has been found that circular cross sections are both effective and easier to manufacture. Each rod is less than a cm in diameter and usually less then 15 cm long. Ions are accelerated by a negative voltage plate before they enter the quadrupole and travel down the center of the rods (in the z direction). The ions’ trajectory in the z direction is not altered by the quadrupole’s electric field.
The various ions are separated by applying a time independent dc potential as well as a time dependent ac potential. The four rods are divided up into pairs where the diagonal rods have an identical potential. The positive dc potential is applied to the rods in the X-Z plane and the negative dc potential is applied to the rods in the Y-Z plane. The subsequent ac potential is applied to both pairs of rods but the potential on one pair is the opposite sign of the other and is commonly referred to as being 180?q out of phase (Figure 4-6).
Mathematically the potentials that ions are subjected to are described by the following equations:
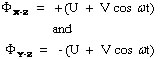
where Φ is the potential applied to the X-Z and Y-Z rods respectively, ω is the angular frequency (in rad/s) and is equal to 2πv where v is the radio frequency of the field, U is the dc potential and V is the zero-to-peak amplitude of the radio frequency voltage (ac potential). The positive and negative signs in the two equations reflect the change in polarity of the opposing rods (electrodes). The values of U range from 500 to 2000 volts and V ranges from 0 to 3000 volts.
Figure 4-6. AC and DC Potentials in the Quadrupole MS.
To understand the function of each pair, consider the rods in the X-Z plane in isolation. For now, imagine that only an ac potential is applied to the rods. Half the time when the potential was positive, ions (cations) would be repelled by the rod’s charge and would consequently move towards the center of the rods. Likewise, when the potential was negative, ions would accelerate towards the rods in response to an attractive force. If during the negative ac potential, an ion comes into contact with the rod, it is neutralized and is removed by the vacuum. The factors that influence whether or not a particle strikes the rod during the negative cycle include the magnitude of the potential (its amplitude), the duration of time the ions are accelerated towards the rod (the frequency of the ac potential), the mass of the particular ion, the charge of the ion, and its position within the quadrupole.
Now imagine that a positive dc potential (at a fraction of the magnitude of the ac potential) is applied to the rod in the X-Z plane. This positive dc potential alone would focus all of the ions towards the center of the pair of rods. When the ac and dc potentials are applied at the same time to the pair of rods in the X-Z plane, ions of different masses respond differently to the resulting potential. Heavy ions are largely unaffected by the alternating current and as a result respond to the average potential of the rods. This results in heavy ions being focused towards the center of the rods. Light ions, on the other hand, will respond more readily to the alternating ac current. Ions that are sufficiently light will have an unstable trajectory in the X-Z plane and will not reach the detector. Only ions heaver than a selected mass will not be filtered out by the X-Z electrodes. As a result, the X-Z plane electrodes only filter light ions and form a high pass mass filter (Figure 4-7).
Now look at the other pair of rods or the converse of the ac/dc potentials. The rods in the Y-Z plane have a negative dc voltage and the ac potential is the same magnitude but the oppose sign as the potential applied to the X-Z plane. Heavy ions are still mostly affected by the dc potential, but since it is negative, they strike the electrode and are unable to reach the detector. The lighter ions respond to the ac potential and are focused towards the center of the quadrupole. The ac potential can be thought of as correcting the trajectories of the lighter ions, preventing them from striking the electrodes in the Y-Z plane. These electrical parameters result in the construction of a low pass mass filter.
When both the electrodes are combined into the same system, they are able to selectively allow a single mass to charge ratio to have a stable trajectory through the quadrupole. Altering the magnitude of the ac and dc potential changes the mass to charge ratio that has a stable trajectory resulting in the construction of mass spectra. Different ions possess a stable trajectory at different magnitudes and reach the detector at different times during a sweep of the ac/dc magnitude range. The graph of the combined effect, shown in Figure 4-7c, is actually a simplification of the actual stability diagram.
Figure 4-7. A “Conceptual” Stability Diagram
One way to generate an actual stability diagram is to perform a series of experiments where a single mass ion is introduced into the quadrupole. The dc and ac voltages are allowed to vary and the stability of the ion is mapped. After performing a great number of experiments the resulting plot would look like Figure 4-8. The shaded area under the curve represents values of ac and dc voltages where the ion has a stable trajectory through the potential and would reach the detector. The white space outside the stability diagram indicates ac and dc voltages where the ion would not reach the detector.
While any ac and dc voltages that fall inside the stability diagram could be utilized, in practice, quadrupoles keep the ratio of the dc to ac potential constant, while the scan is performed by changing the magnitude of the ac and dc potential. The result of this is illustrated as the mass scan line intersecting the stability diagram in Figure 4-8. The graphs below the stability diagram correspond to specific points along the scan and help to illustrate the ions’ trajectories in the X-Z and Y-Z plane (Figure 4-8). While the mass to charge ratio of the ion remains constant in each pair of horizontal figures, the magnitude of the applied voltages are changing while their ratio stays constant. As a result, examining points along the mass scan line in Figure 4-8 is equivalent to shifting the position of the high and low pass mass filters with respect to the x axis illustrated in Figure 4-7. Even though the mass is not changing for the stability diagram discussed here, the mass that has a stable trajectory is altered.
Figure 4-8. Stability Diagram for a Single Ion Mass. Used with permission from the Journal of Chemical Education, Vol. 75, No. 8, 1998, p. 1051; copyright © 1998, Division of Chemical Education, Inc.
In the above figure, the graph corresponding to point A indicates that the ion is too light to pass through the X-Z plane because of the high magnitude of the ac and dc potentials. As a result, its oscillation is unstable, and it eventually impacts the electrode/rod. The motion of the particles in the Y axis is stable because the combination of the ac potential as well as the negative dc potential yields a stable trajectory. This is the graphical representation of the ac potential correcting the trajectory of the light ions in the Y-Z plane. At point B the magnitude of voltages has been altered so the trajectories of the ion in both the X-Z and Y-Z plane are stable and the ion successfully reaches the detector. At point C, the ion has been eliminated by the low mass pass filter. In this case, the ac potential is too low to allow the ion to pass through the detector and it strikes the rod. This is caused by the ions increased response to the negative dc potential in the Y-Z plane. The trajectory in the X-Z axis is stable since the dc potential focusing the ion towards the center of the poles overwhelms the ac potential.
Until this point, the stability diagram shown above is only applicable to a single mass. If a similar experiment were to be performed using a different mass, the positions of the ac and dc potential on the x and y axes would be altered but the overall shape of the curve would remain the same. Fortunately, there is a less time consuming way to generate the general stability diagram for a quadrupole mass filter using a force balance approach. This derivation requires a complex understanding of differential equations and is beyond the scope of an introductory text, but the solution can be explained graphically (Figure 4-9). The parameters in the axes are explained below the figure.
Figure 4-9. The General Stability Diagram
While this derivation is particularly complex, the physical interpretation of the result helps explain how a quadrupole is able to perform a scan. The final solution is dependent on six variables, but the simplified two-variable problem is shown in Figure 4-9. Utilizing the reduced parameters, a and q, the problem becomes a more manageable two-dimensional problem. While the complete derivation allows researchers to perform scans in multiple ways, this discussion will focus only on the basic mode that makes up the majority of mass spectrometers. For the majority of commercially available mass spectrometers, the magnitude of the ac potential (V) and the dc potential (U) are the only parameters that are altered during run time and allows a sweep of the mass to charge ranges. The rest of the parameters that describe K1 and K2 are held constant. The values for K1 and K2 in the general stability diagram can be attributed to the following equations:
![]()
![]()
The parameters that make up K1 and K2 are exactly what we predicted when listing the variables earlier that would affect the point charge. Both K terms depend upon the charge of the ion e, its position within the quadrupole r, and the frequency of the ac oscillation ω. These parameters can be altered, but for the majority of applications remain constant. The charge of the ion (e) can be assumed to be equivalent to positive one, +1, for almost all cases. The distance from the center of the quadrupole (r) is carefully controlled by the manufacturing process and an electronic lens that focuses the ions into the center of the quadrupole and is also a constant. Also the angular frequency (ω) of the applied ac waveform can be assumed to be a constant for the purposes of most spectrometers and for this discussion.
The first important note for the general stability diagram is the relationship between potential and mass. The general stability diagram (Figure 4-8) is illustrated where there is an inverse relationship between the two. Figures 4-9 and 4-10 shows the lighter ions (m-1) are higher on the mass scan line and the heavy ions (m+1) are lower on the line. This is why in Figure 4-8 at point A, the molecule was too light for the selected frequencies, and it was too heavy at point C.
From the general stability diagram, it is also possible to explain how an instrument’s resolution can be altered. The resolution is improved when the mass scan line intersects the smallest area at the top of the stability diagram (Figure 4-10). The resolution can be improved when the slope of the mass line is increased and the slope is directly related to the ratio of U and V. The resolution will subsequently increase until the line no longer intersects the stability diagram. While it would be best for the line to intersect at the apex of the stability diagram, this is impractical due to fluctuations in the ac (V) and dc (U) voltages. As a result, the line intersects a little below this point allowing the quadrupole to obtain unit resolution (plus or minus one amu).
Once the resolution has been determined, the ratio of the ac to dc potential is left unchanged throughout the scan process. To perform a scan, the magnitude of the ac and dc voltages is altered while their ratio remains constant. This places a different mass to charge inside the stability diagram. For example, if the ac and dc voltages are doubled, the mass to charge ratio of the selected ion would also be doubled as illustrated in the second part of Figure 4-10. By scanning throughout a voltage range, the quadrupole is able to create the majority of mass spectra produced in today’s chemical laboratories. But it should be noted that quadrupole mass filters have an upper limit of approximately 650 mass to charge ratios. This is of no consequence in inorganic analysis since all isotopes are well below this limit.
Figure 4.10 Quadrupole Mass Scan. Used with permission from the Journal of Chemical Education, Vol. 63, No. 7, 1998, p. 621; copyright © 1986, Division of Chemical Education, Inc.
View Animation 4-4 for an illustration of how the trajectory of ions of different masses are changed during a mass scan.
Animation 4.4 Illustration of Cations in a Quadrupole Mass Filter.
Now that we have given a detailed description of the factors influencing the movement of a charged particle through the quadrupole, it is advantageous to summarize the entire process as a physicist would do in the form of a force balance. This is the origin of the governing equation where the French scientist E. Mathieu balanced the equations for the motion of ionized particles to the potential forces (electrical potentials) encountered in a quadrupole mass analyzer. This six-parameter differential equation, known as the Mathieu equation is represented by
and where u is either the x or y directional coordinate, Ì is the redefining of time (t/2), e is the charge of the ion, U is the magnitude of the dc potential, Ö is the angular frequency (2Îf) of the applied ac waveform, ro is the distance from the center axis (the z axis) to the surface of any electrode (rod), m is the mass of the ion, and V is the magnitude of the applied ac or radio frequency waveform. By using the reduced terms, a and q, the six-parameter equation (e, Ö, ro, m, U, and V) can be simplified to a two-parameter equation (involving a and q). Thus, when the two opposing forces are balanced, the movement of a charged particle in an electrical field, the particle will pass through the quadrupole and strike the detector.
| Frank's Homepage |
©Dunnivant & Ginsbach, 2008