3.5 Applications
HPLC extends the capabilities of chromatographic separations past the abilities of capillary GC by allowing the analysis of thermally unstable analytes but at the expense of poorer resolving power due to the packed column nature of the system. These limitations are being slowly overcome with the use of capillary columns and ultra high pressure systems. This section highlights a few HPLC applications. As with GC, major column manufacturers and distributors provide very useful websites that contain example chromatograms for common analytes. These sources can be extremely helpful in selecting the appropriate column for your needs. In addition, technical help is available from professional chromatographers at these companies with more complex separations. The chromatograms below were selected from numerous ones that are available from Agilent technologies at http://www.chem.agilent.com/en-us/Search/Library/Pages/ChromatogramSearch.aspx and Dionex Corporation at http://www.dionex.com/en-us/columns-accessories/ion-chromatography.
The first example we will illustrate is for polyaromatic hydrocarbons that can be analyzed very efficiently by GC. While HPLC also offers adequate separation (as shown in Figure 3.10 below) as compared to GC, HPLC allows improved detection limits with the use of fluorescence detection.
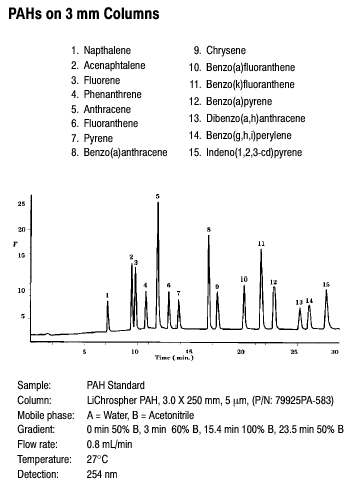
Figure 3.10 Separation of PAHs by HPLC. Source: Copyright 2006 Agilent Technologies, Inc. Reproduced with Permission.
Applications that cannot be performed by GC include the isolation of Vitamin A (Figure 3.11), the separation of proteins (Figure 3.12) and the separation of food coloring agents (Figure 3.13).
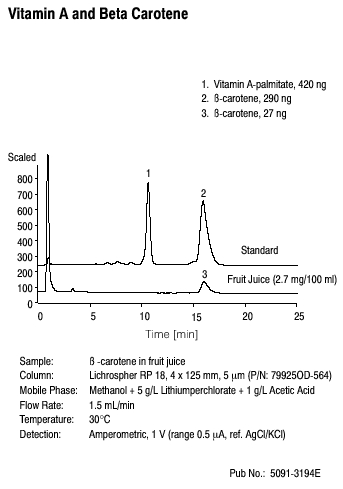
Figure 3.11 Isolation of Vitamin A by HPLC. Source: Copyright 2006 Agilent Technologies, Inc. Reproduced with Permission
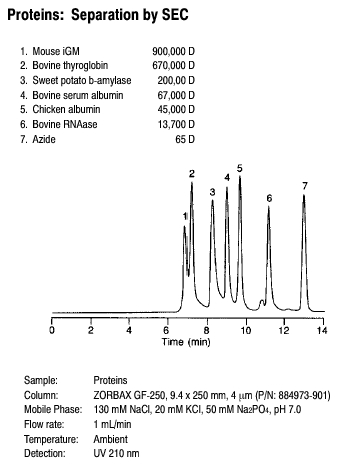
Figure 3.12 The separation of proteins by HPLC. Source: Copyright 2006 Agilent Technologies, Inc. Reproduced with permission.
Figure 3.13 The separation of food coloring agents by HPLC. Source: Copyright 2006 Agilent Technologies, Inc. Reproduced with permission.
A separation of anions in drinking water by IC is shown in Figure 3.14.

Figure 3.14 Separation of anions by IC. Source: Dionex Corporation, Inc. Reprinted with permission, courtesy of Dionex Corporation, Sunnyvale, California.
| Frank's Homepage |
©Dunnivant & Ginsbach, 2008