5.5.6 Fourier Transform Ion Cyclotron – Mass Spectrometry
(by Nicole James)Developed by Alan G. Marshall and Melvin B. Comisarow at the University of British Columbia, the use of FT-ICR MS first began in 1974 with approximately 235 instruments in use by 1998. FT-ICR MS has higher mass resolution and accuracy than any other MS system and can detect multiple mass-to-charge ratio ions simultaneously. However, FT-ICR MS can be prohibitively expensive at $1-2 million for a standard instrument. The general steps of an FT-ICR MS experiment are: (1) ion formation outside of the detector; (2) ion focusing and accumulation; (3) transportation of ions into a Penning trap; (4) selection of ions based on mass-to-charge ratio and ejection of these ions from the Penning trap; (5) excitation; (6) detection; (7) fast Fourier transform of the digital time-domain signal; (8) conversion of frequency to mass-to-charge ratio.
Ion-Cyclotron Motion
If a moving ion is exposed to a uniform magnetic field, it is subject to a force dependent on the mass, charge and velocity of the ion. If an ion does not collide with another particle and hit off its natural course, the magnetic field will bend the ion's path into a circular orbit.
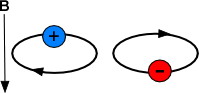
Figure 5.21a Illustration of a particle in a magnetic field.
The motion of the ion can be described by the equation below, where w is the unperturbed ion cyclotron frequency, B0 is the magnetic field in Tesla, q is the charge in Coulombs, and m is the mass in micrograms.

This equation can be rearranged into the following equation where v is the velocity, and z is the charge of the ion in units of elemental charge (e.g., +1, +2, etc).
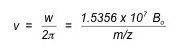
It is important to note that the above equation is dependent on only the mass-to-charge ratio of the ion and not its velocity. This makes ion-cyclotron resonance especially useful in mass spectrometry, as one does not need to focus translational energy—which requires longer experiment times, larger apparatus and more powerful electronics—in order to obtain high-accuracy results.
The radius of the circle an ion makes when exposed to the magnetic field can be found by the equation below, where r is radius in meters, and T is the temperature in Kelvin:
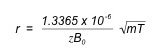
One can see from the above equation that an ion with a mass of 100 amu and a charge of +1 in a magnetic field of 1 Tesla at room temperature (298 K) would have a radius of 0.2 mm; the same ion with triple the magnetic field (3 T) at room temperature would have a radius of 0.077 mm. Thus, ions can be easily confined to a relatively small orbit by a reasonable magnetic field; this is called ion trapping and is vital to ICR-MS because the longer (approximately 1s) experiment times require one to be able to retain the ions in a designated space. Additionally, a 3T magnetic field is easily attainable for commercially available electronics. The largest FT ICR MS built as of 2010 can attain a magnetic field of 15T, allowing one to confine an ion with an m/z value of 60,000.
Ion Cyclotron Excitation and Detection
A number of ions at a specific mass-to-charge ratio spinning in an ion-cyclotron orbit does not, itself, generate an observable electric signal, because (a) the ions were randomly placed (i.e, incoherent; ions are spread throughout the radio of orbit) as they began orbiting, meaning that an ion at a specific position will have its charge cancelled out by an ion half an orbit away from it, leaving no net electrical current, and (b) the radius of the orbits are generally too small to be detectable, even if all ions were in the same phase. Thus, ions must be excited in order to be detected.
Particles in an ion-cyclotron orbit can be excited by applying an oscillating or rotating uniform electric field at or near the frequency of ions of a given mass-to-charge ratio. This excitation can be used for three purposes: (1) accelerating the ions into a larger orbital radius for detection, (2) accelerating the ions to a larger orbital that is ejected from the ion trap, and (3) increasing the kinetic energy of an ion to the point that it further ionizes or reacts with another molecule. For the purposes of this text, excitation in order to accelerate the ions for detection is most significant.
Applying an oscillating or rotating radio-frequency electric field in resonance with (at the same frequency as) a specific m/z value or range applies a force on the ion(s) that continuously enlarges the circular orbit of the ion(s) at one point—in other words, the orbiting ions begin to spiral outward. Ions of different types will spiral outward at different rates. The post-excitation orbit for an ion excited for a period of time, t, is shown in the following equation, where E0 is the applied electric field and B0 is the magnetic field:
![]()
The fact that the above equation is independent of the mass-to-charge ratio of the ion means that all ions can be excited by a radio-frequency electric field to enlarged ion-cyclotron orbits for detection. This simultaneous detection vastly decreases both the time an experiment will take and the amount of analyte required.
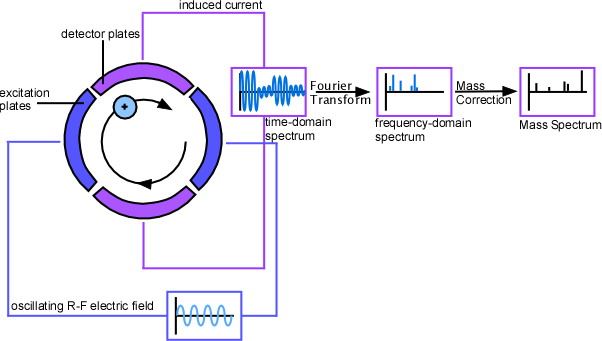
When a group of ions with the same mass-to-charge ratio are excited, they are pushed off-axis due to their spiraling nature. By pushing the ions off axis, not all ions have a “partner” ion half a cycle away—the ions are considered to be “cohered.” A cohered packet of orbiting ions causes a difference in current between opposing detection plates within the ion trap; this differential current can be modeled as an “image” current opposing the current on the detection plates; this image current is proportional to the number of coherent orbiting ions. This is the ICR signal; the ICR signal increases linearly with increasing ion-cyclotron radius after excitation and with increasing ion charge. Throughout most of the frequency range possible on the instrument, the signal-to-noise ratio (S/N) is proportional to the differential current observed. The number of ions required for a S/N ratio of 3:1 on a standard instrument using standard parameters is approximately 190 ions. Other detection processes have been designed to such high accuracy and detection that they are able to detect a single ion and have been used to corroborate the theory that protons and anti-protons do, in fact, have the same mass (Gabrielse et al, 1990).
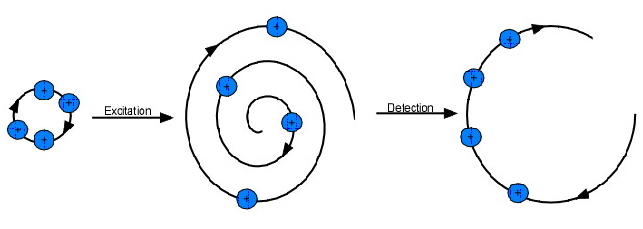
Figure 5.21b Excitation and Detection of an Ion.
The Penning Trap
The most common ion trap used in FT-ICR MS is the Penning trap, designed in the 1950s by Hans Georg Dehmelt, who named it after Frances Michel Penning for his work on the Penning gauge. The ion-cyclotron motion induced by a radial magnetic field contains ions radially, but it is necessary to add an axial electric field in order to trap the ions axially. Thus, the motion of an ion inside a Penning trap is essentially the combination of three distinct motions: the cyclotron, “magnetron” (a component of ion-cyclotron motion), and the axial motion. The axial containment is accomplished by introducing two “end-cap” electrodes. The end-cap electrodes are coupled by capacitance, which allows for a nearly perfect rf electric field to be used for the ion-cyclotron excitation without any negative effects on other electronics. Opposing plates with an electric field applied across them within the Penning trap are used as detector plates.
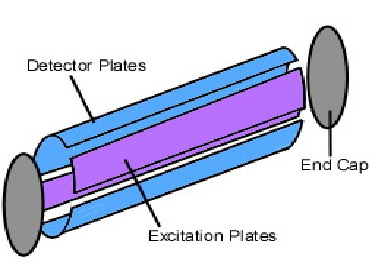
Figure 5.21c Diagram of a Penning Trap.
Analysis of Results
The signal detected by an experiment is in units of current per time. To extract mass-to-charge data, one must apply a Fourier transform. In general, a Fourier transform (FT) takes a time-based signaland converts it into a frequency-based plot. Since the initial function is a function of time, it is typically called the time domain; the frequency plot is called the frequency domain, or the frequency domain representation of the initial function. More specifically, the Fourier transform uses the fact that almost any function can be degraded into a sum of sine and cosine waves; each component sine and/or cosine wave represents a periodic component of the data. By finding each component sine or cosine wave, one can make a frequency plot by representing a specific sine or cosine wave as a peak on a plot of amplitude versus the frequency of the wave. The sharper the peak, the more “exact” the periodicity is; in most real-life applications, the peak will be somewhat broad—not just a vertical line.
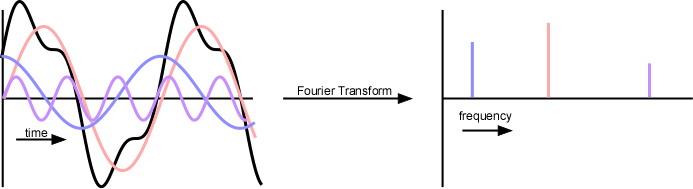
Figure 5.21d Graphic Representation of the Fourier-Transform Process where a time domain signal is transformed to a frequency output.
A Fourier-transform of the (time-domain) ICR response results in a frequency plot that can be mass-corrected to result in a mass spectrum. Obtaining this mass spectrum with most other types of MS would have required sweeping slowly across the entire range of mass-to-charge ratios; being able to quickly and simultaneously detect all mass-to-charge ratios decreases the time, effort and supplies that must be used to test a sample. In addition, the greatly increased resolution means that FTICR-MS will continue being an extremely powerful instrument.
| Frank's Homepage |
©Dunnivant & Ginsbach, 2008