6.5 Identification of Analytes using Isotopic Ratios
Since the majority of elements have two or more isotopes, the ratio of these isotopes can be a powerful tool in deriving the composition of unknown samples. For example, a small peak one mass unit higher than a prominent peak is observed in mass spectra or organic molecules. This is caused by the natural abundance of 13C which will replace the more abundant 12C isotope. Background noise and a lack of resolution in the majority of mass spectrometers prevent the ratio of various isotopes from being an identification technique for all compounds.
However, some isotopes are so prominent that they can easily be observed with a quadrupole mass spectrometer with unit resolution. Chlorine, bromine, and sulfur can all be identified by their isotopic ratios. The isotopic ratios of commonly encountered elements are summarized in Table 6.1. In Table 6.2, the ratios have been normalized to the most abundant isotope to illustrate the expected peak ratios in a mass spectrum. Compounds containing one chlorine have a [M + 2] peak that is one third the size of the molecular ion (Figure 6.5a). Compounds containing one bromine have a [M + 2] peak that is approximately the same height as a [M+] peak (Figure 6.5b). Compounds containing sulfur have an unusually large [M + 2] (Figure 6.5c).
Table 6.1 Natural Occurring Isotopic Abundances of Common Elements
Element |
|
|
|
hydrogen |
1H 100.0% |
|
|
carbon |
12C 98.9% |
13C 1.1% |
|
nitrogen |
14N 99.6% |
15N 0.4% |
|
oxygen |
14O 99.8% |
18O 0.2% |
|
sulfur |
32S 95.0% |
33S 0.8% |
34S 4.2% |
chlorine |
35Cl 75.5% |
37Cl 24.5 % |
|
bromine |
79Br 50.5% |
81Br 49.5% |
|
iodine |
127I 100.0% |
Table 6.2 Relative Isotopic Abundances of Common Elements
Element |
[M+] |
[M + 1] |
[M + 2] |
hydrogen |
1H 100.0% |
|
|
carbon |
12C 100.0% |
13C 1.1% |
|
nitrogen |
14N 100.0% |
15N 0.4% |
|
oxygen |
16O 100.0% |
18O 0.2% |
|
sulfur |
32S 100.0% |
33S 0.8% |
34S 4.4% |
chlorine |
35Cl 100.0% |
37Cl 32.5 % |
|
bromine |
79Br 100.0% |
81Br 98.0% |
|
iodine |
127I 100.0% |
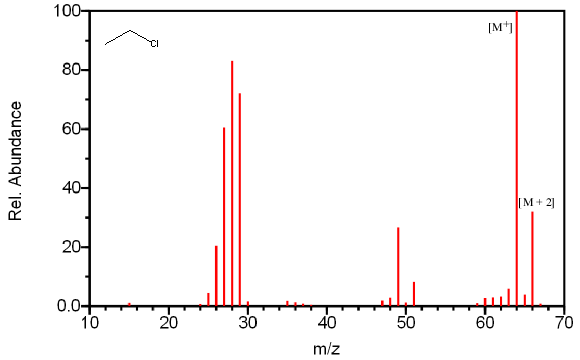
For ethyl chloride, Figure 6.5A illustrates the presence of a [M + 2] peak that is about 25% of the [M+] peak.
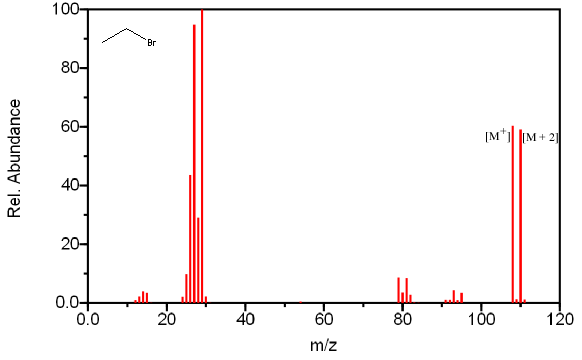
In Figure 6.5B, bromoethane has a characteristic [M + 2] peak that has a similar intensity as the [M+] peak.
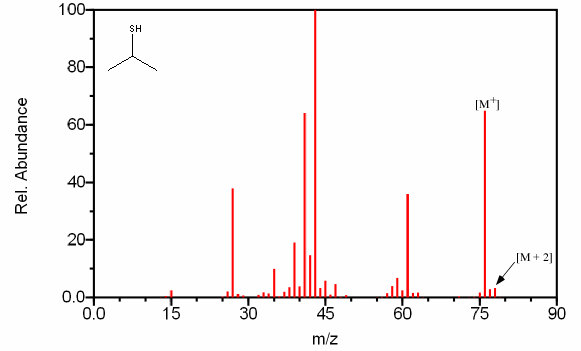
For 2-Propanethiol, Figure 6.5C contains a larger than usual [M + 2] peak, a pattern observable in sulfur containing compounds.
Figure 6.5A-C. Isotopic Identification. Spectra from the NIST/EPA/NIH Mass Spectral Library. Reprinted with permission from NIST.
Compounds can also contain any combination of multiple chlorine and bromine atoms. These samples will produce distinct peaks due to the various combinations of the isotopes. A compound containing two bromines will have a [M + 2] peak twice the size of the [M+] peak and a [M + 4] peak the same size as the [M+] peak (Figure 6.6a). A compound containing two chlorines will have a [M + 2] peak that is two thirds the size of the [M+] peak and a [M + 4] peak that is ten percent of the molecular ion (Figure 6.6b).
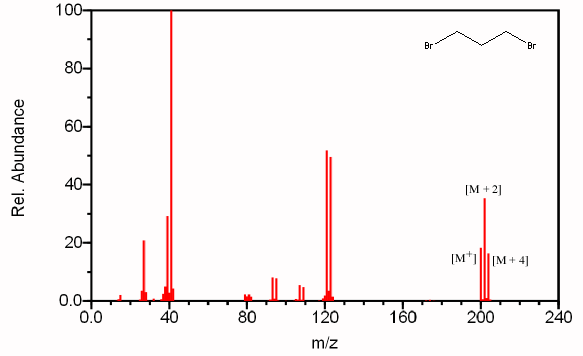
Figure 6.6A shows the mass spectrum the dibrominated compound 1,3-dibromopropane.
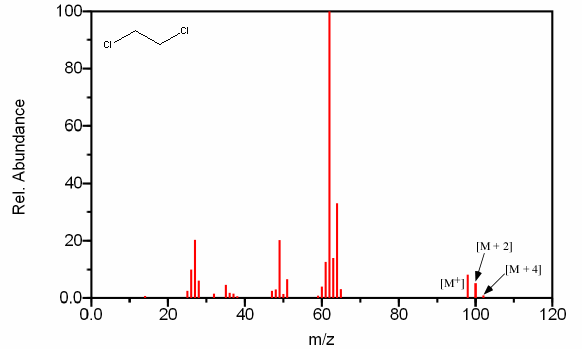
Figure 6.6B shows the mass spectrum of the dichlorinated compound 1,2-dichloroethane.
Figure 6.6. Polybrominated and Polychlorinated Compounds. Spectra from the NIST/EPA/NIH Mass Spectral Library. Reprinted with permission from NIST.
Iodine is more difficult to detect because it is one of the few compounds that is monoisotopic. Despite this fact, the large atomic mass of iodine simplifies its identification. The combination of a peak at m/z 127 (I+) and a large gap of 127 mass units between fragments containing iodine and fragments lacking in iodine allows for the compounds identification (Figure 6.7).
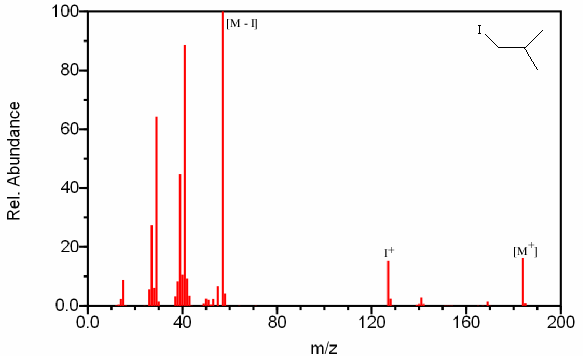
Figure 6.7. Mass Spectrum Containing Iodine. Spectra from the NIST/EPA/NIH Mass Spectral Library. Reprinted with permission from NIST.
| Frank's Homepage |
©Dunnivant & Ginsbach, 2008