7.2 Preliminary Experiments: Getting to Know Your Instrument
7.2.1 Autotuning the MS
MS instruments must be tuned frequently to ensure correct identification of ion mass to charge ratios; modern instruments have an automated sequence or menu to do this. Most instruments use perfluorotribuylamine (PFTBA) that is stored in a vial in the MS. During the tuning procedure, a valve is opened to allow a small, consistent mass of PFTBA to enter the ionization chamber. Typical concentrations of vapor range from 1 to 10 ppm PFTBA. As PFTBA passes through the MS, the instrument optimizes several settings to obtain the maximum detector response (counts per second) for selected ion fragments of the tuning compound. Results from one of the most common brands on the market (Agilent 5975C) are shown in Figure 7.1.
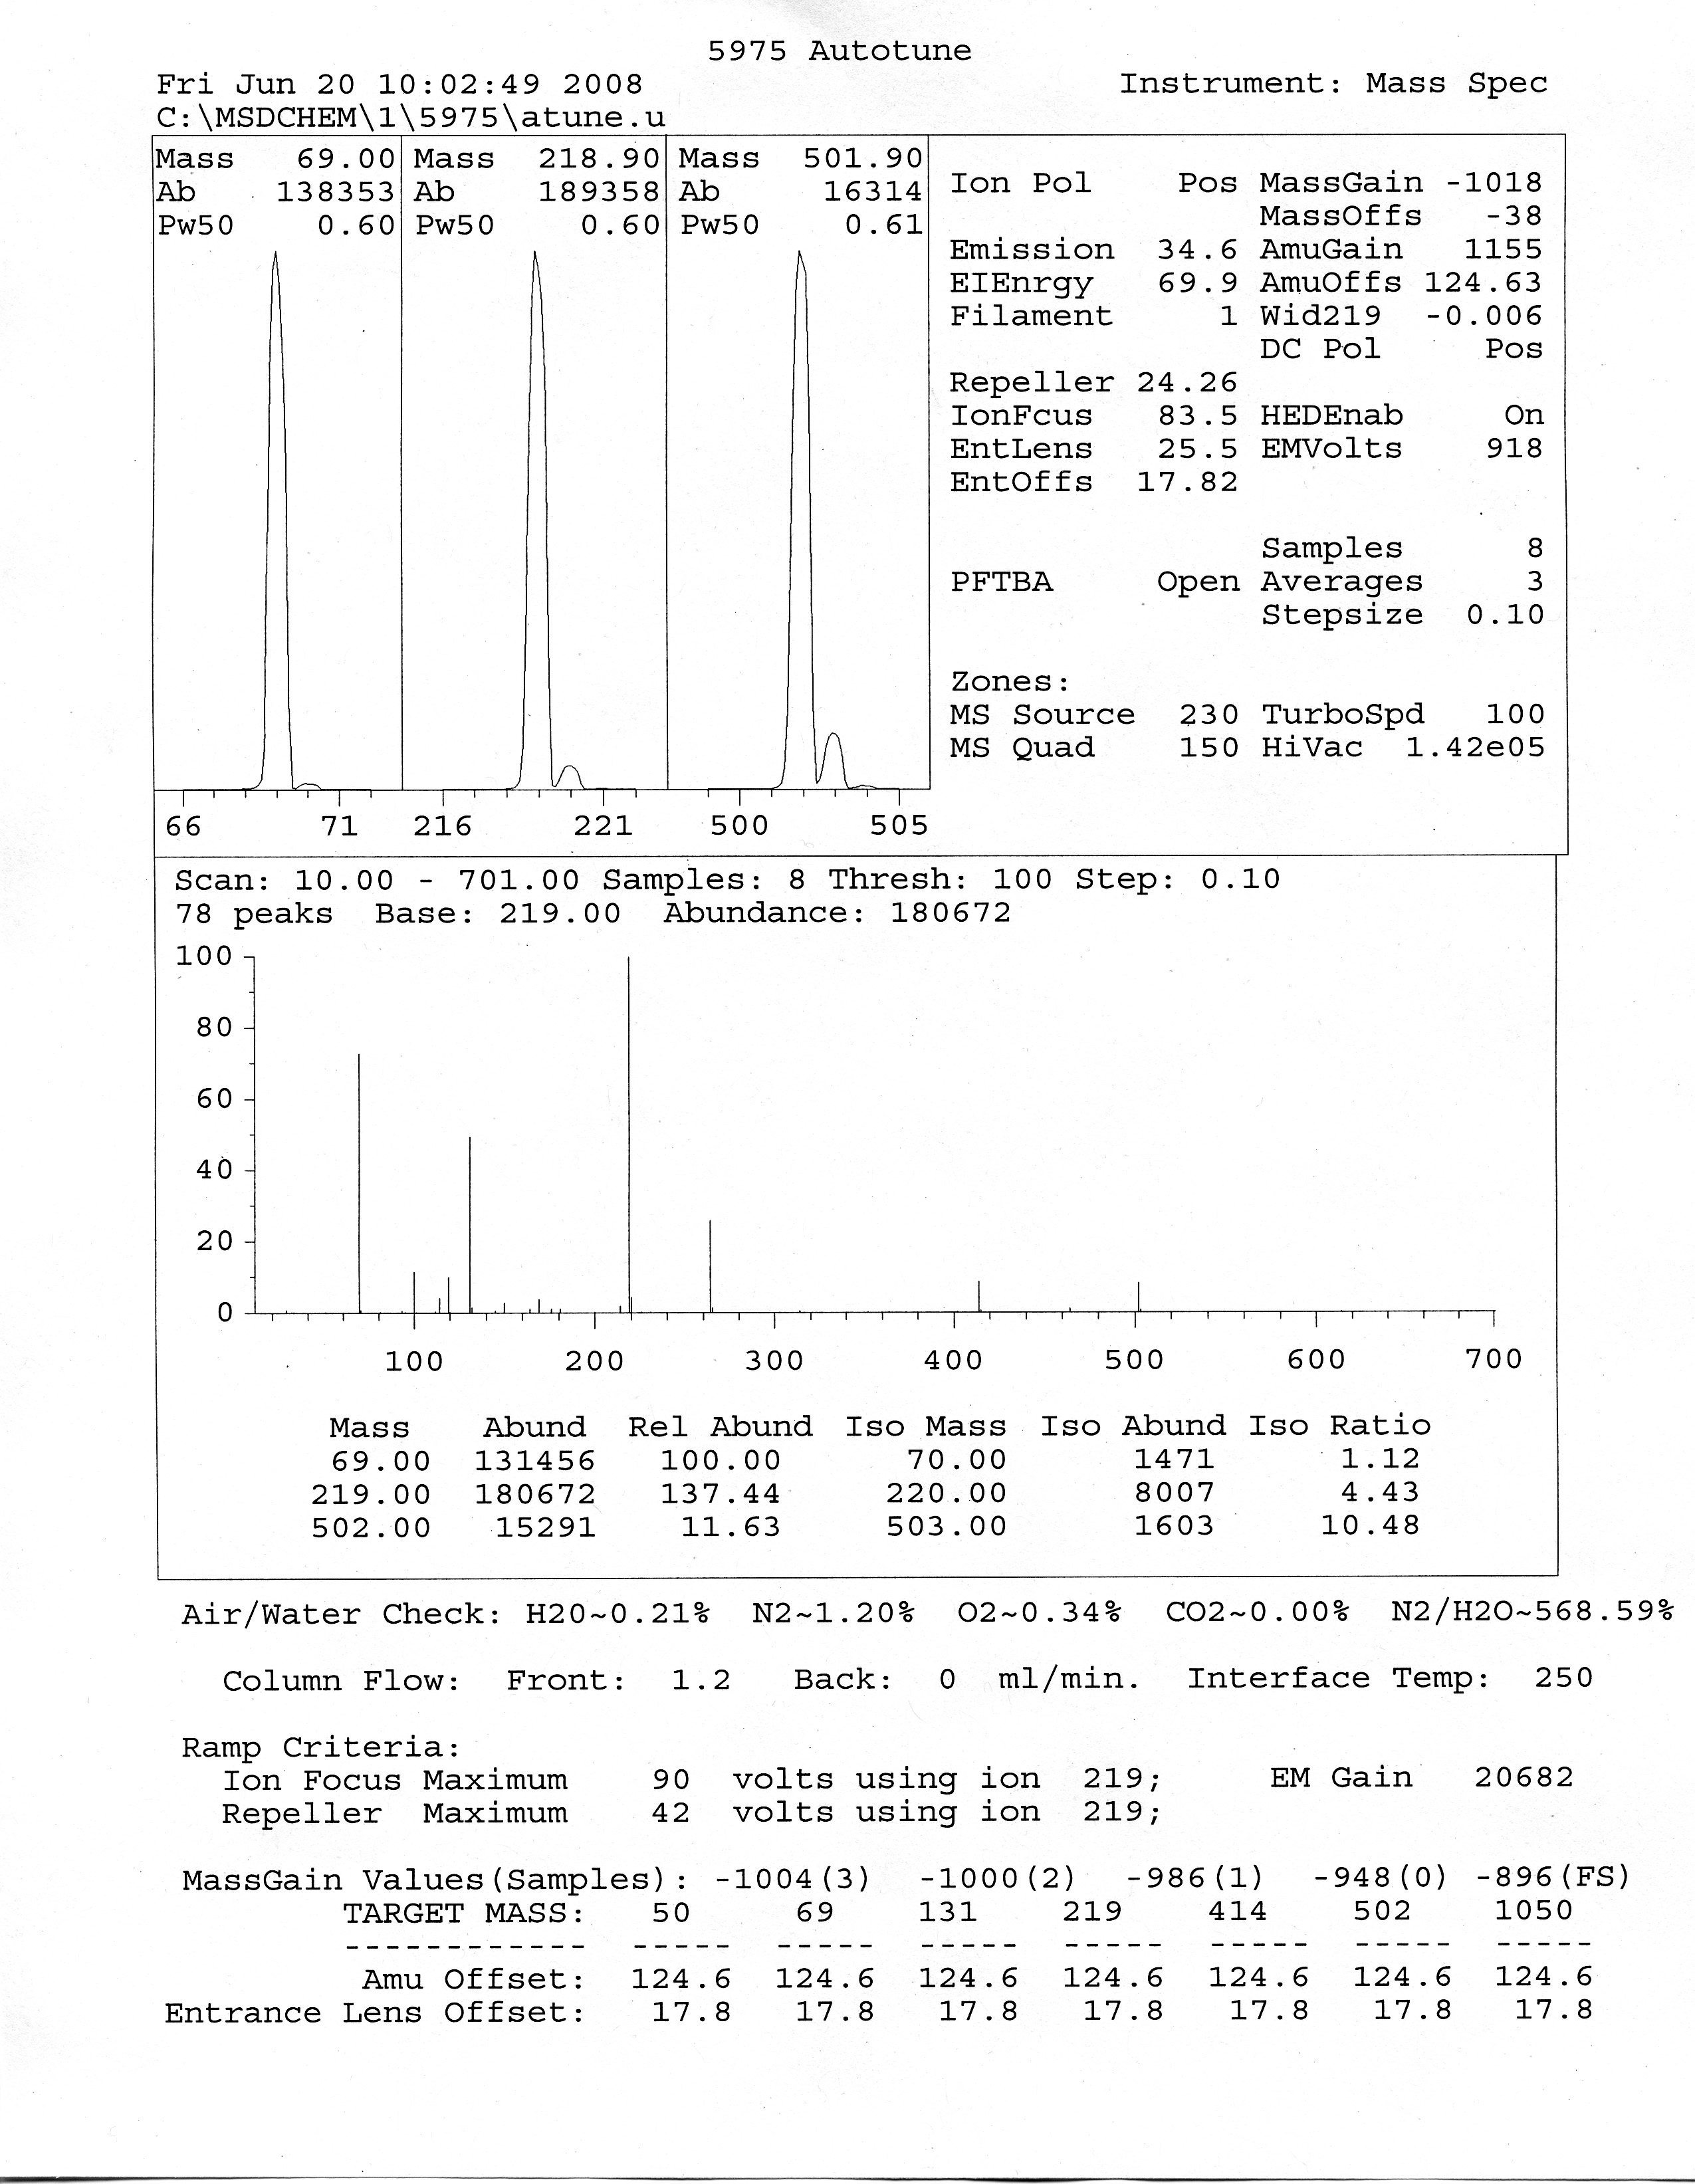
Figure 7-1. A Typical Electron Ionization Tune File from an Agilent 5875 EI-Quadrupole Mass Spectrometer.
Interpretation of the tune file. printout: The center plot in Figure 7.1 is a chromatogram of PFTBA showing the abundance of each ion as a function of temperature. Below the plot are the observed counts per second for three m/z ratios (69 amu, 219 amu, and 502 amu) and their corresponding C-13 isotope-containing ions (the small peak to the immediate right of each tune peak) after the instrument has been successfully tuned. The counts per second for each ion are given in the “Abund” (abundance) column below the chromatogram. The 69, 219, and 502 ions are used to calibrate the m/z values over the entire range of the spectrum.
Now look at the top left-hand side of the figure. This contains expanded scale enlargements of the three m/z peaks. Recall that the quadrupole mass analyzer only yields unit mass resolution. Each of the peaks shown in Figure 7-1 is the result of 10 data point measurements evenly spread across the single amu measurement.
There are several objectives of the tune function. One objective is to calibrate the mass analyzer with respect to mass, so the instrument assigns the large peaks at 69 and 219 to these masses, while the isolated ion at 502 is calibrated to the 502 m/z value. A second objective is to obtain unit resolution as shown in the enlarged plots where the presence of C-12 and C-13 in each of the ions is resolved. A third objective of the tune is to calibrate the instrument where peak height can be used in the counts per second measurements instead of peak area since peak height calculations are faster to calculate and thus allow faster analysis. This last objective is accomplished by normalizing the width at half peak maximum for each of the three ion peaks to similar or near identical values. Each of these objectives is accomplished by sequentially adjusting the parameters listed on the top right-hand side of the figure. These include the voltages of the Repeller, Ion Focus (IonFcus), entrance lens (EntLens), entrance offset (EntOffs), AmuGain and Amu offset (AmuOffs). Recall that the repeller is located on the upstream side of the ionization source and is positively charged to “push” the ionized molecules (cations) toward the mass analyzer. Most of the inertia/velocity imposed on the ion is from charge placed on the repeller. The other lens focuses the ions into the center of the trajectory towards the mass analyzer. The mass width of the peak is primarily adjusted by the AmuGain and AmuOffs parameters. All of the other parameters shown in the top right corner of the figure are normally held constant.
Each of the parameters are adjusted sequentially until the maximum counts per second, resolution, and similar half peak width are achieved; as one parameter is changed, the instrument readjusts the previously adjusted parameters for optimum performance. Finally the EMVolts (potential applied across the electron multiplier) is adjusted so that the 69 m/z ion has a counts per second of approximately 500 000.
Leaks can be detected in the tune process by reviewing the Air/Water Check line of data located immediately below the center total ion chromatogram (TIC). The presence of H2O, N2, O2, CO2 and N2/H2O are shown here and should be present at no more than 10 percent of the total 69 m/z ion counts. If values higher than this are encountered, a leak is present, and is usually located at the vacuum door or column inlet fitting.
| Frank's Homepage |
©Dunnivant & Ginsbach, 2008