7.4.2 Analysis of Cocaine Concentration on U.S. Currency by John Nelson and David Wallace
There has been an increase in the use of cocaine in the United States since the late 1950s. Originally obtained in extremely small doses through extraction from the coca plant by oral chewing, cocaine is now harvested in large quantities and extremely high purity. It is often found in its crystalline form. This form of cocaine is taken into the body by snorting through the nasal cavity, allowing the drug to take effect quickly. The most common method for snorting cocaine involves rolling paper money to form a straw by which the cocaine can be sucked into the nose.
The most common currency used for snorting cocaine in the United States is the one-dollar bill. Once a bill is used to snort cocaine, it can then come into contact with other bills, transferring a small portion of the residual cocaine. This proliferation of trace amounts of cocaine has led previous studies to conclude that four out of every five dollar bills have trace amounts (above 0.1 μg) of cocaine on them.
This study further examines the frequency of cocaine contamination on dollar bills and employs methodologies to increase precision in the measurement of cocaine concentration.
Experimental Procedures
This study largely employed the use of the procedure found in “Cocaine Contamination of United States Paper Currency” by Oyler J. et al. from 1996.
Ten one-dollar bills obtained from a random cash register in Walla Walla, Washington were placed in glass vials that were filled with 10.0 mL of HR-GC grade methanol. These vials were allowed to stir for a period of 24 hours to ensure that all present cocaine was dissolved from the currency. After stirring, the methanol was decanted from the vials and 10 mL of sodium acetate buffer (10 mL, 2M, pH 4.0) was added to samples and allowed to mix. The buffered samples were then filtered through solid-phase extraction (SPE) columns to extract the cocaine from any other compounds that were dissolved by the methanol. Each column was washed with deionized water (1x, 2 mL) and 0.1 M HCl (1x, 1.5 mL) and aspirated to dryness. The columns were then washed with methanol (2x, 1 mL) and aspirated to dryness again. The cocaine analytes were then eluted from the columns using a 80:20:2 ratio of methylene chloride, isopropanol, and concentrated aqueous ammonium hydroxide. The elution solvent was added to the columns (6x, 1 mL) and allowed to drip into clean glass tubes.
The elution solvent was then evaporated to dryness using high purity helium. This concentration of the elution solvent will provide a higher signal to noise ratio when analyzed by gas chromatography (GC). 100 μL of methanol was added to the glass tubes to allow the cocaine analyte to redissolve. The methanol was then transferred to glass gas chromatography (GC) vials for analysis.
An external calibration curve was made with concentrations of 10, 25, 40, 50, and 100 ppm cocaine. Five samples were analyzed by GC-MS using a temperature program starting at 180 oC and ending at 250 oC with a ramp of 5 oC per minute. The analyte concentration was measured by comparing the analyte response to the calibration curve responses to achieve part-per million concentration levels.
This procedure was repeated with the use of a derivatizing agent (BSTFA with 1% TMCS) to increase the signal strength of the analyte. The derivatizing agent was added to the final 100 μL of methanol in equal volume and allowed to heat in a 50 oC oven for 1 hour. The derivatizing agent was also added to the external calibration standards.
Results:
Two separate calibration plots were constructed from the calibration standards of each run. A linear regression line was fit to each of these plots from which the concentration of cocaine in each of the corresponding samples was determined. Five samples were run along with the calibration standards without derivatizing agent, and four derivatized samples were run with the derivatized standards. Table 7-2 shows the cocaine concentrations obtained for each sample. The derivatized samples and calibration curve yielded substantially better results and detection limits than samples run without derivatizing agent—for this reason, the use of a derivatizing agent is crucial to obtaining precise and accurate results. Data for both calibration lines are reproduced below.
Table 7.2 Instrument Calibration and Extraction Results
Cocaine Calibration - Underivatized |
|
|
|
|
Concentration (ppm) |
Response |
Slope |
Y Intercept |
R2 |
25 |
96 |
316 |
-9182 |
0.99359 |
40 |
2136 |
|
|
|
50 |
6082 |
|
|
|
100 |
22810 |
|
|
|
|
|
|
|
|
Sample Number |
Response |
Concentration (ppm) |
Amount On Bill (mg) |
|
1 |
2718 |
37.707 |
0.37707 |
|
2 |
1161 |
32.7734 |
0.327734 |
|
3 |
4633 |
43.775 |
0.43775 |
|
4 |
1740 |
34.6081 |
0.346081 |
|
5 |
8352 |
55.5593 |
0.555593 |
|
|
|
|
|
|
Cocaine Calibration - Derivatized |
|
|
|
|
Concentration (ppm) |
Response |
Slope |
Y Intercept |
R2 |
10 |
1580 |
261 |
-604 |
0.989426 |
25 |
5786 |
|
|
|
40 |
11947 |
|
|
|
50 |
10947 |
|
|
|
100 |
25540 |
|
|
|
|
|
|
|
|
Sample Number |
Response |
Concentration (ppm) |
Amount On Bill (mg) |
|
1 |
13589 |
52.0651 |
0.520651 |
|
2 |
14100 |
54.0229 |
0.540229 |
|
3 |
12512 |
47.9387 |
0.479387 |
|
4 |
3795 |
14.5402 |
0.145402 |
|
Figure 7-12. Total Ion Chromatogram of a Cocaine External Calibration Standard. The retention time of cocaine is just under 20 mintutes.
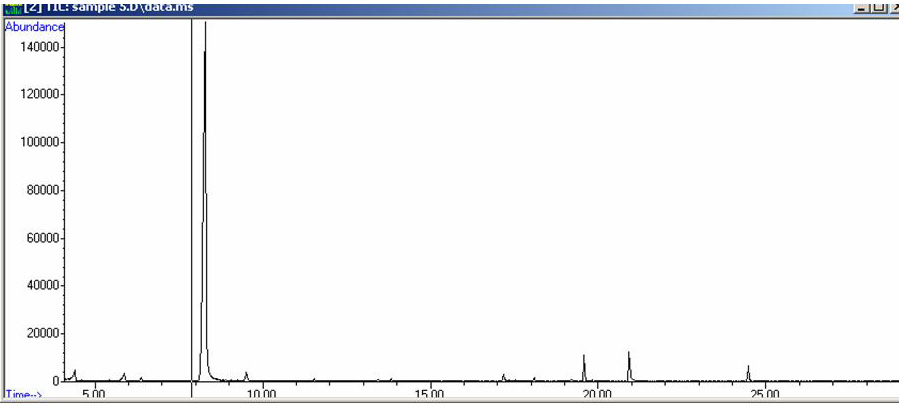
Figure 7-13. Total Ion Chromatogram of a Sample Extract. Again, the retention time of Cocaine is near 20 minutes.
Figure 7-14. The Mass Spectrum and Fragmentation of Cocaine.
References
Jenkins, A.J. 2001. Drug Contamination of US Paper Currency, Forensic Science International, Vol. 21, pp. 189-193.
Oyler, J., W.D. Darwin, and E.J. Cone. 1996. Cocaine Contamination of United States Paper Currency, J. of Analytical Toxicology, Vol 20, July/August, pp. 213-216
| Frank's Homepage |
©Dunnivant & Ginsbach, 2008