7.5.3 SPME-GC-MS Analysis of Wine Headspace by Bailey Arend
For many consumers, the aroma of a wine is nearly as important as the flavor. The wine industry is obviously interested in producing wine with pleasing and abundant aroma. More than 1000 compounds have been identified in the headspace of wine, including alcohols, esters, carbonyls, acids, phenols, lactones, acetals, thiols, terpenols and many more (Weldegergis, et al, 2007; Polaskova, et al, 2008)] Although human senses can detect surprisingly small concentrations of certain volatile organic compounds in wine headspace, analytical instrumentation provides a more specific and precise way to measure the headspace character of wine.
The complex matrix of wine, as well as the low concentration of some of the volatile compounds presents further obstacles in the characterization of wine aroma. To analyze many of the compounds, sample enrichment techniques must be employed (Weldegergis, et al., 2007) liquid-liquid extractions using organic solvents (Andujar-Ortiz, et al., 2009; Ortega-Heras, et al., 2002) and solid phase extraction (SPE) (Andujar-Ortiz, et al., 2009; Dominguez, et al., 2002) are both effective for wine analyses, however solid-phase micro extraction (SPME) presents a major advancement in volatile compound analyses.
SPME was first introduced in 1989 by Belardi and Pawliszyn for analysis of organic pollutants in water. The original method involved immersing fiber coated with fused-silica stationary phase directly in the liquid analyte[6]. Analytes are sorbed/adsorbed onto the solid phase, which can then be inserted directly into a gas chromatograph (GC) injector, where the analytes are thermally desorbed and loaded onto the GC column. The newer SPME has drawn much attention for being versatile, yet simple. The technique does not require expensive, high-purity, toxic organic solvents generally associated with instrumental analysis and eliminates many possible sources of error.
SPME was first modified for headspace analysis in 1993. The new method exposed the coated fiber to the sample headspace only, which was found to shorten the extraction time while maintaining detection limits in the ppt range (Zhang and Pawliszyn, 1993). The driving theory behind any SPME is the partition coefficient of the analyte between the coating and the solvent or vapor. The partition coefficient along with the large difference in volume between the coating and headspace volume result in impressive concentration factors. The mass of analyte adsorbed to the coating (n) is given by
n= CoV1V2K1K2/(K1K2V1+K2V3+V2),
where Co is the original concentration in the liquid phase, and the volumes of the three phases in equilibrium are as follows: V1 for the coating, V2 for the liquid phase, and V3 for the headspace (Zhang and Pawliszyn, 1993). Minimizing the ratio of headspace to sample volume (V3<<V2) and maximizing the affinity of the coating for analyte (large K1) can boost the amount of adsorbed analyte. This allows direct injection of analyte to the GC without risking instrument damage by injecting concentrated and sugary wine matrix. HS-SPME also avoids many complications of matrix effects, even allowing analysis of solid samples and human blood (Cardinali et al., 2000), as long as the analyte is volatile (Zhang and Pawliszyn, 1993). Tat et al. found that 50/30μm Divinylbenzene/Carboxen/Polydimethylsiloxane coated fiber gave the most sensitive and repeatable results for the analysis of wine headspace (Tat, 2005).
Aside from fiber coatings and volume ratios, other parameters that can affect the sensitivity of HS-SPME are exposure time, temperature, and pH of the sample solution (wine). Exposure time is logically related to the concentration of analyte sorbed to the fiber. Sufficient time must be given for the system to reach equilibrium before the equation above is valid. Temperature governs the fraction of analyte present in the headspace and available for adsorption. Many methods immerse the extraction vial in a heated water bath (Tat, 2005), however, care must be taken that the fiber, headspace and condensed phase are all in thermal equilibrium. The pH values have been adjusted in some studies (Boutou and Chatonnet, 2007) to allow multiple classes of molecules to be in their most analyzable form. For example, to simultaneously adjust for pyrazines (which are best analyzed at neutral to basic pH values, pKa ~ 0.50) and phenols (pKa ~25, which are best analyzed at low pH values) Boutou and Chatonnet adjusted all samples to a pH value of 7.
The method of Boutou and Chatonnet was also sufficient for analysis of contaminants that cause off flavors in wine. Compounds such as 2,4,6-trichloroanisole, 2,3,4,6-tetrachloroanisole, 2,4,6-tribromoanisole have olfactory perception thresholds near 10 ng L-1 and give wine a “barnyard” character (Boutou and Chatonnet, 2007). Wines with these contaminants are referred to as “corked” and are quite undesirable. Analysis of such contaminants can determine the origin of contamination and improve wine production techniques (Boutou and Chatonnet, 2007).
Materials and Methods:
Sampling conditions (adopted from Tat, 2005)
Sample wines and all equipment were stored at room temperature to ensure thermal equilibrium and minimize thermal differences between samples. Thirty-two (32.0) mL of sample wine was pipetted into a 40-mL glass vial equipped with a septum. The septum was pre-punctured with a sharp, hollow needle to avoid contaminating or breaking the fiber by contact with the septum. The extraction fiber was a Supelco 50/30μm Divinylbenzene/Carboxen/Polydimethylsiloxane Stableflex fiber conditioned at 270°C in the GC inlet for 1 hour. The fiber was inserted into the vial via the septum before being exposed. The fiber was exposed to the headspace while the wine was stirred. The extraction was performed at 25°C for 15 minutes. When finished, the fiber was immediately inserted into the gas chromatograph injector, where it remained for the entire duration of the temperature program.
Instrumental Parameters (adopted from Boutou and Chatonnel, 2007)
GC/MS analysis was performed with:
-Column: HP-5MS 5% Phenyl Methyl Siloxoane 30.0m x 250 μm x 0.25 μm nominal capillary column.
-Carrier gas: helium (ultra high purity, 99.999% passed through hydrocarbon traps) programmed to flow at a constant linear rate of 54.1 mL/min for the entire run. The injector lining was ensured to be long enough to allow full insertion of the fiber and operated by manual injection. The injector was operated in splitless mode at 270°C for the entirety of the each run.
-
The oven program started at 50°C for 2.0 min, and then increased at 3.0°C min-1 to 190°C. The temperature was than increased at 50°C min-1 to 320°C where it was held for 5min. Detection was performed by an Agilent 5975C inert EI/CI MSD quadrupolar mass detector with EI ionization (source temperature 230°C, quadrupole temp. 150°C, energy of constant ionization 70).
-
The entire method required a total of 56 min.
Results:
This study was conducted to demonstrate the ease and versatility of HS-SPME for student chemists. For this reason, no adjustments were made to the wine samples and the recommended heating of the samples was not performed. Although the range of detectable analytes was much smaller than other methods have reported (Tat, 2005; Boutou and Chatonnel, 2007), the quick and simple method returned multiple analyte peaks for each wine tested.
It was found to be important to thermally clean the extraction fibers before each exposure. Samples of Black Box Merlot were run without cleaning the fiber and unexpected compounds were observed (shown in Figure 1). Many silica compounds were found in the blank runs, which could possibly be attributed to degradation of the fiber coating (shown below in Figure 2). If the fiber was “baked out” directly before exposure, the presence of these compounds was minimized (shown below in Figure 3).
The method was repeated 5 times on Black Box 2007 California Merlot and the results were found to be reproducible. One advantage of using boxed wine is that the affects of oxidation are eliminated. Samples may be drawn weeks apart, whereas opening a bottled wine introduces oxygen to the entire bottle and could affect the composition of the wine (Simpson, 1978).
While the method was found to be repeatable, only a limited number of identifiable compounds were recovered for each sample. These compounds are shown in Figure 7-26 below and include 3-methylbutyl acetate, ethyl hexanoate, 2-phenylethanol, diethyl succinate, ethyl octanoate and ethyl decanoate. The chromatogram for Chardonnay (Buckley’s Cove, South Eastern Australia, 2009, Figure 6) does not contain 2-phenylethanol and diethyl succinate which were found in all red wine samples. It is possible that the lack of these two compounds could be a signifier of white wine.
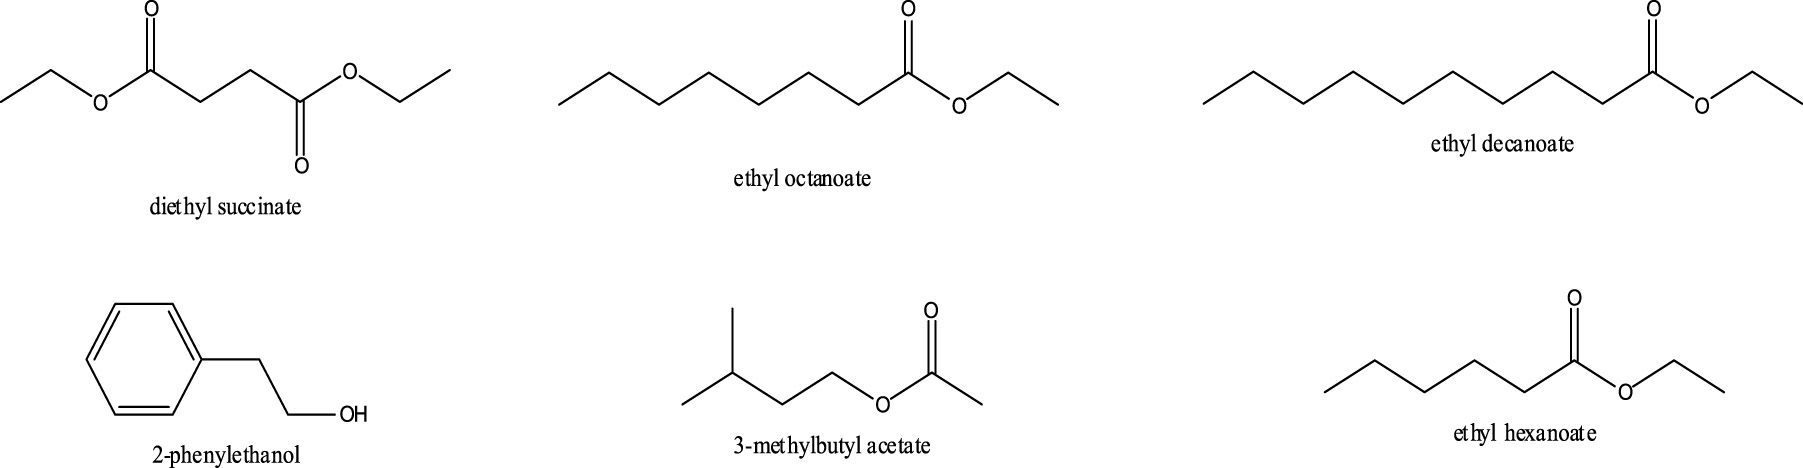
Figure 7-26. The compounds repeatedly found in all red wine samples by the proposed method.
It was thought that a higher-quality wine would have a stronger bouquet and yield more volatile compounds, however the chromatogram of Red Table Blend from Walla Walla Village Winery (82%Cabernet Sauvignon, 9% Merlot and 9% Cabernet Franc, Figure 7-27) did not show additional peaks. This method was also insufficient to characterize contaminants in a sample of corked wine from Foundry Vineyards in Walla Walla (2005 Red Wine), (shown in Figure 7-28). It is likely that heating of the samples or adjustment of the other parameters, such as pH, would increase the range of compounds detectable by this method.
Although this simplified method does not engage the full potential of HS-SPME techniques, it is sufficient to demonstrate the theory and application of such techniques in a college/university laboratory. Additional streamlined methods may be developed for other consumable complex matrices such as whiskey or vinegar.
Chromatograms
![]()
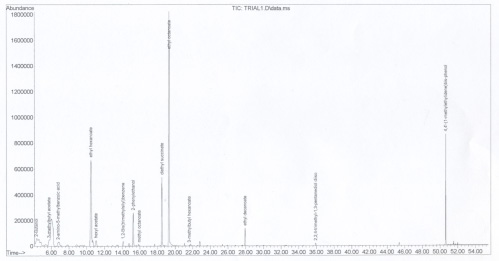
Figure 7-27. The chromatogram for Black Box California Merlot, 2007. No blank was run and unusual peaks were observed.
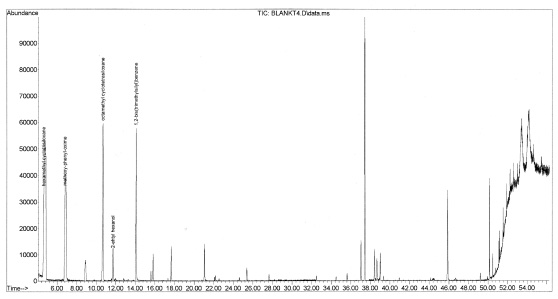
Figure 7-28. The fiber was subjected to an entire run without exposure to any sample. Multiple contaminants were observed, demonstrating the need to run blanks and thermally clean the fiber between samples.
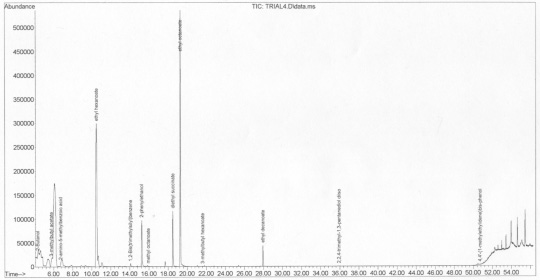
Figure 7-29. The chromatogram for Black Box California Merlot, 2007. The fiber was exposed to the sample immediately after subjecting it to a blank run. Fewer contaminants were observed.
![]()
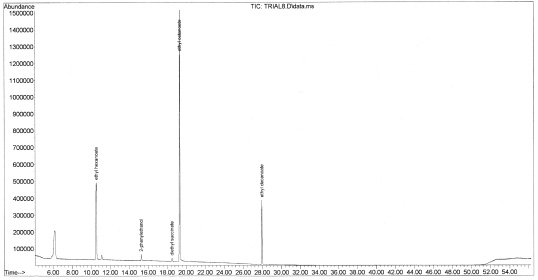
Figure 7-30. The chromatogram for Buckley’s Cove 2009 Shiraz from South Eastern Australia. Relatively few volatile compounds were detected.
![]()
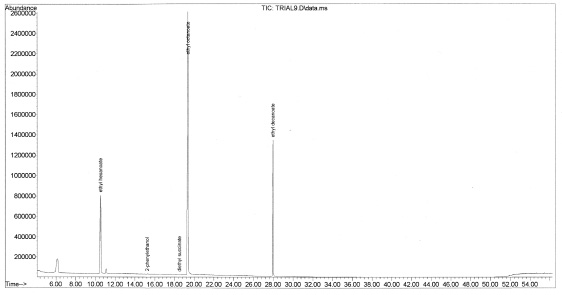
Figure 7-31. The chromatogram for Buckley’s Cove 2009 Chardonnay from South Eastern Australia differs slightly from Buckley’s Cove Shiraz (Figure 4). 2-Phenylethanol and diethyl succinate that were found in the Shiraz were not observed in this sample.
![]()
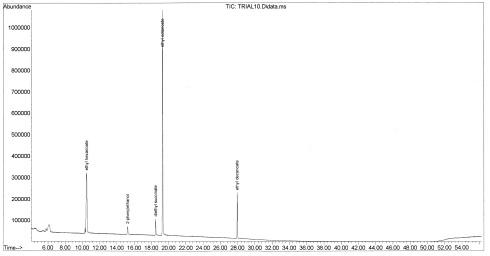
Figure 7-32. The chromatogram for Walla Walla Village Winery’s Red Table Blend (82%Cabernet Sauvignon, 9% Merlot and 9% Cabernet Franc). Contrary to our prediction, no additional compounds were detected in the higher-quality wine. Changing the sample parameters could aid the detection of additional volatiles.
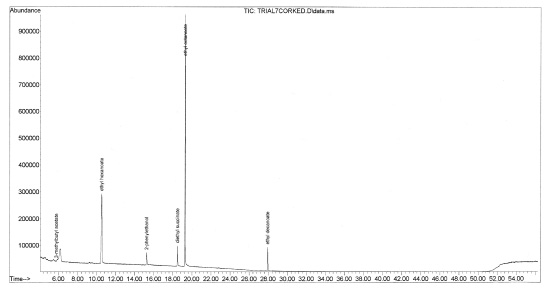
Figure 7-33. The chromatogram for Foundry Vineyards 2005 Red Wine. “Corked” wines have a displeasing aroma caused by trichloroanisole or tribromoanisole (Boutou and Chatonnet, 2007). The streamlined method could not detect the presence of these compounds, however changing the sample parameters such as temperature or pH could improve detection of these contaminants.
References
Weldegergis, B.T., A.G.J. Tredoux, and A.M. Crouch, Application of a Headspace Sorptive Extraction Method for the Analysis of Volatile Components in South African Wines. Journal of Agricultural and Food Chemistry, 2007. 55(21): p. 8696-8702.
Polaskova, P., J. Herszage, and S.E. Ebeler, Wine flavor: chemistry in a glass. Chemical Society Reviews, 2008. 37(11): p. 2478-2489.
Andujar-Ortiz, I., et al., Analytical performance of three commonly used extraction methods for the gas chromatography-mass spectrometry analysis of wine volatile compounds. Journal of Chromatography A, 2009. 1216(43): p. 7351-7357.
Ortega-Heras, M., M.L. Gonzalez-SanJose, and S. Beltran, Aroma composition of wine studied by different extraction methods. Analytica Chimica Acta, 2002. 458(1): p. 85-93.
Dominguez, C., D.A. Guillen, and C.G. Barroso, Determination of volatile phenols in fino sherry wines. Analytica Chimica Acta, 2002. 458(1): p. 95-102.
Robert P. Belardi, J.B.P., Application of Chemically Modified Fused Silica Fibres in the Extraction of Organics from Water Matrix Samples and the Rapid Transfer to Capillary Columns. Water Pollution Research Journal of Canada, 1989. 24: p. 179-191.
Zhang, Z. and J. Pawliszyn, Headspace solid-phase microextraction. Analytical Chemistry, 1993. 65(14): p. 1843-1852.
Cardinali, F.L., et al., The use of solid-phase microextraction in conjunction with a benchtop quadrupole mass spectrometer for the analysis of volatile organic compounds in human blood at the low parts-per-trillion level. Journal of Chromatographic Science, 2000. 38(2): p. 49-54.
Tat, L., et al., Optimization of wine headspace analysis by solid-phase microextraction capillary gas chromatography with mass spectrometric and flame ionization detection. Food Chemistry, 2005. 93(2): p. 361-369.
Boutou, S. and P. Chatonnet, Rapid headspace solid-phase microextraction/gas chromatographic/mass spectrometric assay for the quantitative determination of some of the main odorants causing off-flavours in wine. Journal of Chromatography A, 2007. 1141(1): p. 1-9.
Simpson, R.F., AROMA AND COMPOSITIONAL CHANGES IN WINE WITH OXIDATION, STORAGE AND AGING. Vitis, 1978. 17(3): p. 274-287.
| Frank's Homepage |
©Dunnivant & Ginsbach, 2008