7.3 Concept Illustrative Experiments
7.3.1 Advantages of GC-MS over GC
Capillary columns provide superior resolution over packed columns, and while separations of complex mixtures are usually complete, some samples can be problematic. This is also why a single GC analysis for an analyte, even with a reference standard, is not conclusive, but suggestive. As discussed in Chapter 1, GC analysis (in the absence of MS detection) can be considered conclusive when a sample is analyzed twice, once on one stationary phase and once on a different stationary phase, and when the same results from these two analyses confirm the present of an analyte based on retention time.
In contrast, gas chromatography-mass spectrometer analysis can give conclusive identification for many structures, with or without a reference standard. But MS analysis requires that a pure compound be introduced into the MS or that a GC be used to separate a complex mixture of analytes. This is the purpose of this experiment, to show the identification power of MS. Polychlorinated biphenyls (PCBs) will be used for illustration purposes here, and there are many other classes of compounds that can be used for this purpose (i.e. alkanes, aromatics, etc.). There are 209 different PCBs, ranging from monochlorobiphenyls to a single decachlorobiphenyl. PCBs are usually separated/analyzed on a non-polar column such as the polydimethyl siloxane phase (commonly referred to as HP-1, SP-1, or DB-1) or the poly(phenylmethyldimethyl) siloxane phase (commonly referred to as HP-5, SP-5, or DB-5). These columns mainly separate non-polar analytes based on boiling points and given the possibility of similar structures in PCBs (and other classes of compounds), some compounds will have similar boiling points and therefore similar retention times in the chromatogram (lack of separation). However, given the range of boiling points of the 209 PCBs a very slow oven temperature ramp (~1.0 oC per minute) is necessary that results in a long analysis time (approximately 2 hours). In this experiment the lack of separation will be illustrated for 2,2’-dichlorobiphenyl and 2,6-dichlorobiphenyl.
Experimental Procedures
Chemicals and Supplies:
-A 25 ppm solution of 2,2’-DCB in isooctane
-A 25 ppm solution of 2,6-DCB in isooctane
-An isooctane solution containing 2,2’-DCB and 2,6-DCB (25 ppm each)
GC-MS Settings:
-Capillary Column: DB-5: Poly(phenylmethyldimethyl) siloxane (5 % phenyl)
30 m x 0.25 mm; 0.25 mm phase coating
-Injection Volume: 1.00 mL
-Splitless Injection for: 0.50 min.
-Split Flow Rate: 50 mL/min.
-Column Flow: 1.2 mL/min.
-Linear Velocity: 40 cm/s
-Injector Temperature: 250 C
-Detector Temperature: 230 C
-Quadrupole Temperature: 150 C
-Oven Program: 70 C for two minutes, 5 C to 280 C, hold for 2 minutes
-Total Run Time: 46 min.
Procedures:
Inject the standard solutions and analyze them using the instrument conditions given above.
RESULTS:
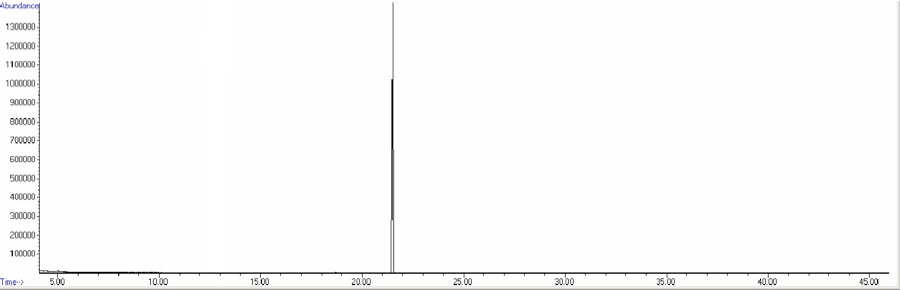
Figure 7-8. Total Ion Chromatogram of a 25ppm solution of 2,2’-dichlorobiphenyl and 2,6-dichlorobiphenyl.
Figure 7.8 shows the analysis results for a solution containing both 2,2’- and 2,6- dichlorobiphenyl. Note the lack of separation; individual injections shows that 2,6’-DCB elutes at 21.494 minutes while 2,2’-DCB elutes at 21.506 minutes. An injection of a combined solution does not resolve the two analytes. A slower temperature ramp may allow the separation of these compounds, or separation can be improved with a longer column or with a thicker film coating. But again there are instances where gas chromatography cannot adequately separate some compounds. If only one of the compounds is present in a GC peak we may still be able identify it using MS. For example, review the two spectra below.
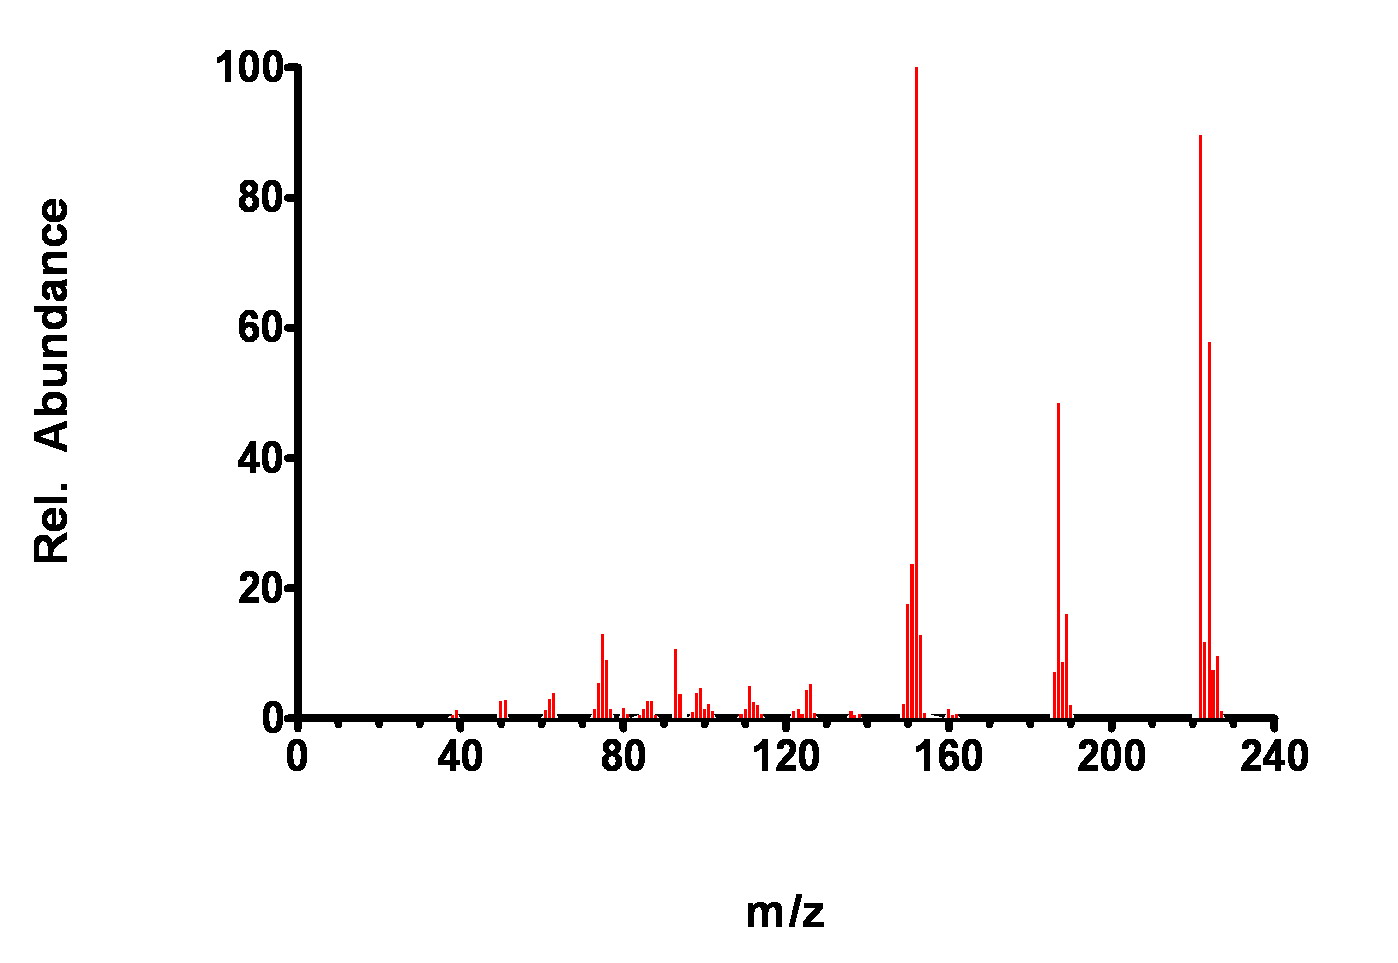
Figure 7-9. Mass Spectrum of 2,2’-dichlorobiphenyl.
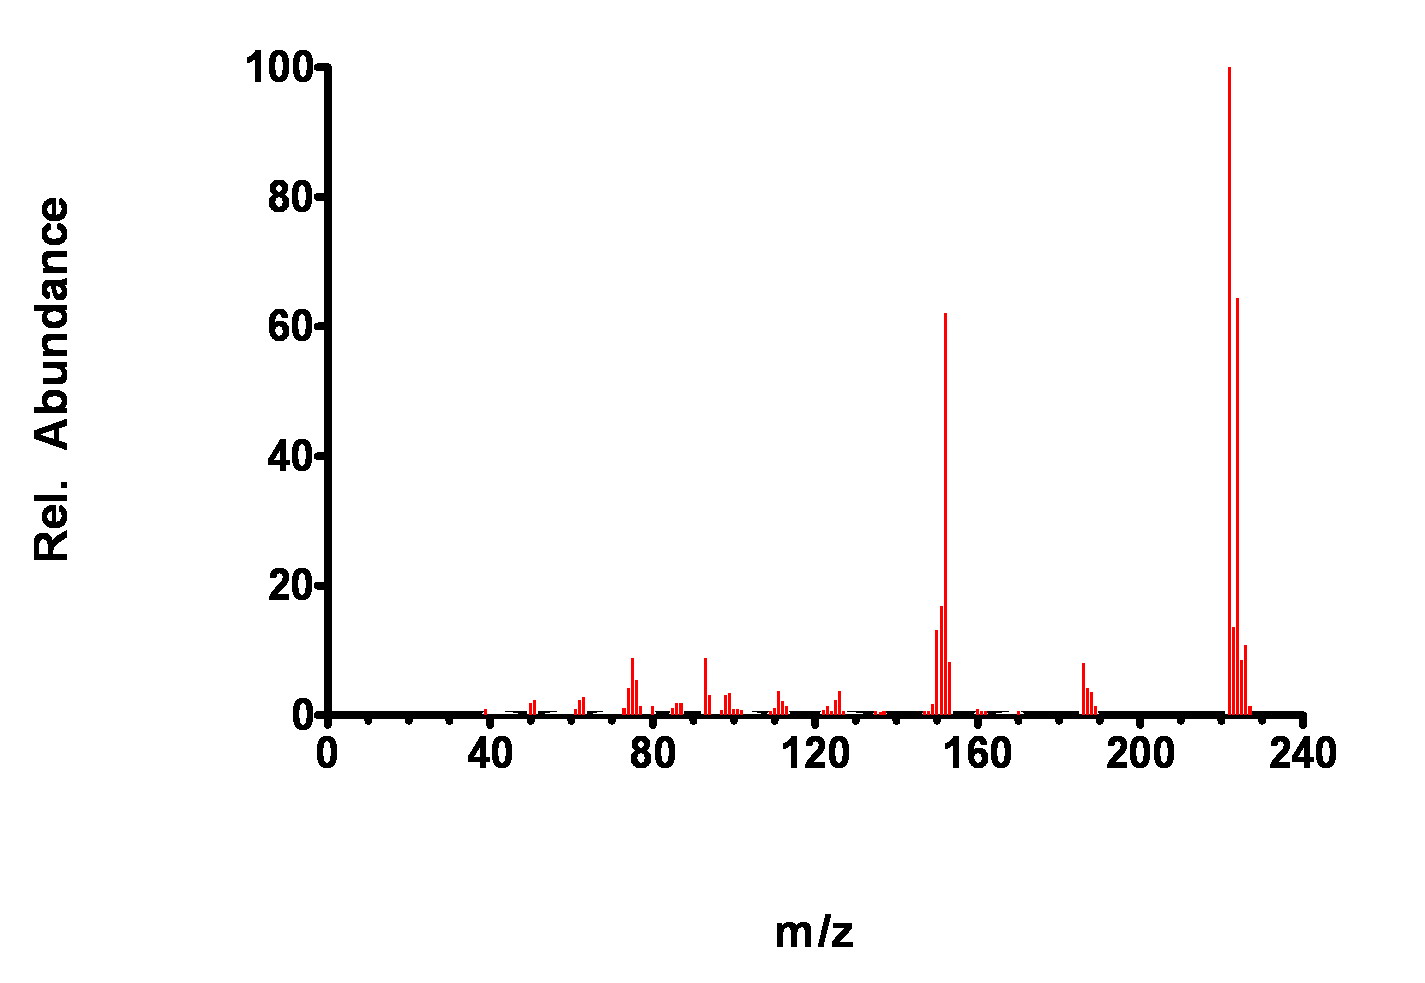
Figure 7-10. Mass Spectrum of 2,6-dichlorobiphenyl.
While these spectra look similar at first glance, distinct differences (relative ion abundance heights) can be noted that are used by the GC matching algorithm to identify the compound. Recall, the library search routine mainly uses two criteria to match an analysis with a known from the library spectra: presence of a m/z peak and relative heights of the m/z peaks.
Similar m/z peaks are present in each spectra but the relative proportions are distinctly different, especially in the186-190 m/z region. Thus, if only one of the compounds is present in a GC peak, it can be easily identified.
As an aside, it should be noted that if milligram quantities of the analytes could be obtained, NMR could be used to identity their presence and abundance, even in a mixed solution.
| Frank's Homepage |
©Dunnivant & Ginsbach, 2008